An Atlanta brokerage running a dozen or more agents is managing a multi-million-dollar pipeline, and most brokers are doing it with a gut feeling and a spreadsheet someone updates on Monday mornings. National online real estate lead conversion sits at just 0.4–1.2%, and without a dashboard that actually shows which agents and which lead sources are converting, a broker has no reliable way to know whether that number is being hit, beaten, or quietly missed month after month.
In plain numbers: Combined-channel real estate lead conversion averages roughly 2–5%; referrals convert far higher, at 15–25%, while portal leads land at just 0.4–1.2% (HyperLeap, 2026 real estate lead response statistics). Every point of that gap is invisible to a broker without a system-level view across every agent’s pipeline, not just their own dashboard inside GoHighLevel.
Here’s the plain version of the problem: an individual agent can usually tell you how their own month is going. A broker running the whole team almost never can, not with real numbers — because the data lives scattered across a dozen agent sub-accounts, an ad platform, and a spreadsheet somebody half-updates before a leadership meeting.
Why this matters even more for an Atlanta brokerage
Atlanta is one of the busiest real estate markets in the Southeast, and a few things make a rollup view especially valuable here:
- A major corporate relocation hub. Atlanta’s concentration of corporate headquarters means a steady flow of relocation buyers with no existing agent relationship — exactly the lead type where response speed and source tracking matter most.
- Large multi-agent teams and brokerages. With bigger teams comes a wider spread in individual agent performance, and without a rollup view, a broker only finds out an agent is underperforming when it’s already cost several closings.
- Dense local competition. In a market this size, lead-source ROI decisions (where to put ad dollars, which portals actually convert) matter enormously, and guessing gets expensive fast.
What “managing by feel” actually costs a broker
Picture a 15-agent brokerage where three agents are quietly outperforming the rest by 3x, and two are barely converting anything. Without a dashboard, that difference shows up eventually — in a slow quarter, or when someone finally compares closing numbers by hand. With a dashboard, it shows up in week two, while there’s still time to coach, reassign leads, or adjust lead-source spend.
2–5%
Average combined-channel real estate lead conversion
15–25%
Conversion rate for referral leads specifically
0.4–1.2%
Conversion rate for portal leads (Zillow, Realtor.com, etc.)
| Item | Value |
|---|---|
| Referrals — high end | 25% |
| Referrals — low end | 15% |
| Combined channels — high end | 5% |
| Combined channels — low end | 2% |
| Portal leads — high end | 1.2% |
| Portal leads — low end | 0.4% |
Source: HyperLeap, 2026 real estate lead response statistics
If referrals convert 5–10x better than portal leads, a broker who can’t see lead-source ROI at a glance is almost certainly over-investing in the wrong channel — a dashboard doesn’t create better leads, it just makes that gap impossible to miss.
What should a broker dashboard actually show?
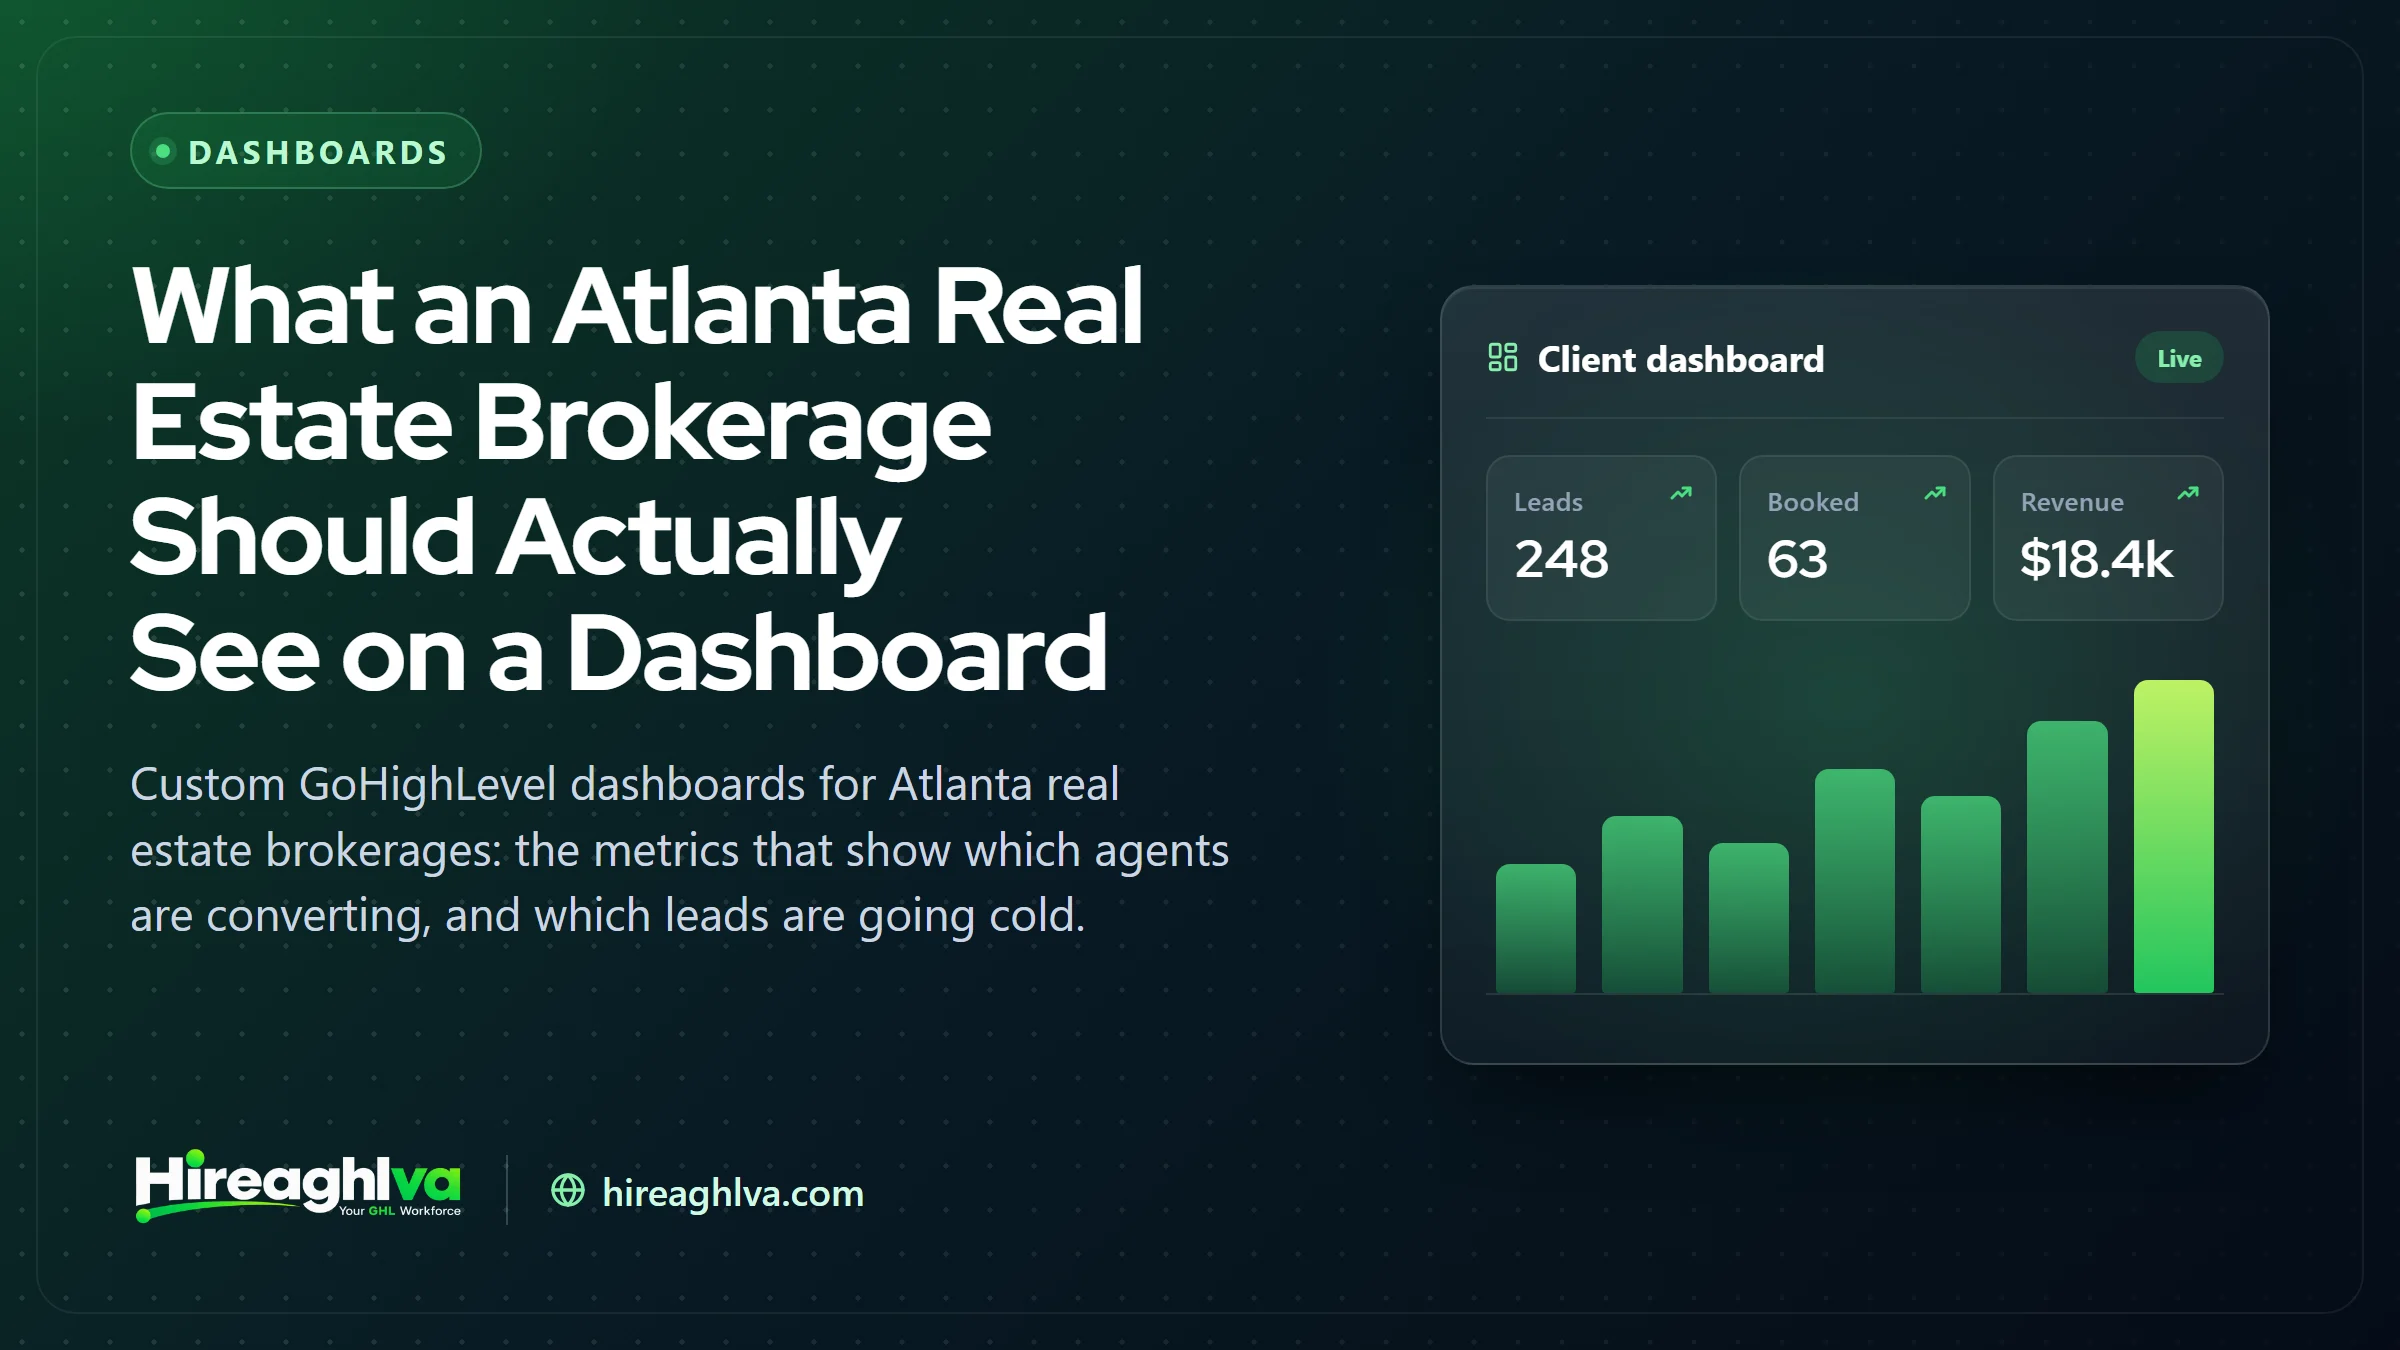
A brokerage dashboard should separate pipeline health, agent performance, and lead-source ROI into one rollup view — distinct from what any single agent sees day to day. In plain terms, that means:
What a brokerage-level dashboard should track, and why it matters
| Metric | What it shows | Why a broker needs to see it |
|---|---|---|
| Pipeline value by agent | Total dollar value of active deals per agent, by stage | Shows who's actually busy vs. who's coasting on old leads |
| Lead-source ROI | Which channels (referral, portal, ads) actually convert | Stops ad spend going to the channel that converts worst |
| Average time-to-close by agent | How long a deal takes from lead to closing, per agent | A strong leading indicator of who's following the process |
| Stalled-lead flag | Any lead untouched past a set number of days | Catches a going-cold lead before a quiet quarter reveals it |
A client-facing view, separate from the internal one. Clients and sellers should see a clean view of their own transaction’s progress — not the brokerage’s internal agent-performance numbers or other clients’ data, the same separation we cover in our guide to white-label client portals and reporting.
Automatic updates, not a Monday-morning assembly job. The whole point breaks down if someone still has to manually pull numbers from three tools every week — a properly built dashboard pulls from GoHighLevel and connected tools on its own, the same approach we cover in our guide to building GoHighLevel dashboards clients actually trust.
Manual reporting vs. a custom dashboard
Someone assembles it by hand every week
- Manual weekly reporting
- Custom brokerage dashboard
Shows agent performance in real time
- Manual weekly reporting
- Custom brokerage dashboard
Flags a stalled lead automatically
- Manual weekly reporting
- Custom brokerage dashboard
Separate views for clients vs. internal team
- Manual weekly reporting
- Custom brokerage dashboard
Lead-source ROI visible at a glance
- Manual weekly reporting
- Custom brokerage dashboard
Hours spent building reports each month
- Manual weekly reporting
- Several
- Custom brokerage dashboard
- Zero
| Manual weekly reporting | Custom brokerage dashboard | |
|---|---|---|
| Someone assembles it by hand every week | ||
| Shows agent performance in real time | ||
| Flags a stalled lead automatically | ||
| Separate views for clients vs. internal team | ||
| Lead-source ROI visible at a glance | ||
| Hours spent building reports each month | Several | Zero |
What you actually get
Cutting through the technical description, here’s what changes for an Atlanta broker:
- You stop finding out about a problem agent a quarter too late. Underperformance shows up in the numbers in week two, not at the annual review.
- You know where your marketing dollars are actually working. If portal leads convert at 0.4% and referrals convert at 20%, that’s no longer a guess — it’s a number on a screen you check in the morning.
- Nothing goes cold silently. A lead that’s been sitting untouched for three weeks gets flagged automatically instead of discovered by accident.
- You get hours back every week that used to go into building reports by hand — time that goes back into actually running the brokerage.
- Clients see a polished, branded view of their own transaction, not a generic GoHighLevel screen that looks like every other agency’s account.
Bringing it together
A brokerage that’s growing past a handful of agents outgrows “checking in with everyone individually” fast — and the gap between a top-converting agent and a struggling one is invisible until someone builds a system to actually show it. Pair a properly built dashboard with a well-structured real estate snapshot and a fast real estate website, and a broker gets the full picture: leads coming in, a pipeline handling them consistently, and a dashboard that shows exactly how well it’s working, agent by agent.
Written by the Hireaghlva GoHighLevel team
We build and run GoHighLevel accounts, automations, dashboards, and websites for agencies and local businesses across the US and Canada. This guide reflects that hands-on work, with sources cited inline where we reference outside data.